
Table of Contents
- Overview
- Prerequisites
- Quick Architecture
- Install / Setup
- Base Configuration
- Reload/Enable & Health Checks
- Security / Hardening
- Performance & Optimization
- Backup & Restore
- Troubleshooting (Top issues)
- Key Takeaways & Next Steps
Overview — Prometheus Grafana Monitoring
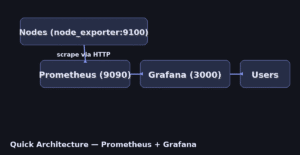
prometheus grafana monitoring stack — This guide sets up a Prometheus + Grafana stack for Linux servers. Prometheus scrapes metrics, node_exporter exposes host metrics, and Grafana provides dashboards and alerting. We’ll cover installation across multiple distros, secure defaults, and copy‑pasteable configs.
Prerequisites
- One monitoring server (PROMETHEUS_HOST) and one or more Linux nodes to monitor.
- Ports: 9090 (Prometheus), 9100 (node_exporter), 3000 (Grafana).
- Placeholders to replace: PROM_IP (Prometheus server IP), NODE1_IP, NODE2_IP, GF_ADMIN_PASS.
- Distros covered: Ubuntu/Debian, RHEL-family (RHEL/Rocky/CentOS Stream/Fedora), Arch/Manjaro, openSUSE/SLE.
Quick Architecture
Install / Setup — Prometheus + Grafana
1) Install Prometheus, node_exporter, and Grafana.
Ubuntu/Debian
# Prometheus + node_exporter from package manager
sudo apt update
sudo apt install -y prometheus prometheus-node-exporter

# Grafana OSS repo
sudo apt install -y apt-transport-https software-properties-common wget
wget -q -O - https://packages.grafana.com/gpg.key | sudo gpg --dearmor -o /usr/share/keyrings/grafana.gpg
echo "deb [signed-by=/usr/share/keyrings/grafana.gpg] https://packages.grafana.com/oss/deb stable main" | sudo tee /etc/apt/sources.list.d/grafana.list
sudo apt update && sudo apt install -y grafana
RHEL-Family (RHEL/Rocky/CentOS Stream/Fedora)
# Prometheus + node_exporter
sudo dnf -y install prometheus prometheus-node_exporter

# Grafana OSS repo
sudo dnf -y install dnf-plugins-core
sudo dnf config-manager --add-repo https://packages.grafana.com/oss/rpm
sudo rpm --import https://packages.grafana.com/gpg.key
sudo dnf -y install grafana
Arch / Manjaro
sudo pacman -Sy --noconfirm prometheus prometheus-node-exporter grafanaopenSUSE / SLE
sudo zypper refresh
sudo zypper install -y prometheus golang-github-prometheus-node_exporter grafana
2) Enable and start services.
# On monitoring server
sudo systemctl enable --now prometheus grafana-server

# On each node (including the monitoring server if you want host metrics there)
sudo systemctl enable --now prometheus-node-exporter || sudo systemctl enable --now node_exporter
Base Configuration
3) Configure Prometheus to scrape itself and your nodes (one-shot heredoc). Replace IPs first.
# /etc/prometheus/prometheus.yml
sudo tee /etc/prometheus/prometheus.yml > /dev/null <<'PROM'
global:
  scrape_interval: 15s
  evaluation_interval: 15s

scrape_configs:
  - job_name: 'prometheus'
    static_configs:
      - targets: ['localhost:9090']

  - job_name: 'nodes'
    static_configs:
      - targets: ['NODE1_IP:9100', 'NODE2_IP:9100']
PROM

sudo systemctl restart prometheus
4) (Optional) Create a Prometheus systemd override to restrict privileges.
sudo mkdir -p /etc/systemd/system/prometheus.service.d
sudo tee /etc/systemd/system/prometheus.service.d/override.conf > /dev/null <<'OVR'
[Service]
NoNewPrivileges=true
ProtectSystem=full
ProtectHome=true
PrivateTmp=true
CapabilityBoundingSet=
OVR
sudo systemctl daemon-reload && sudo systemctl restart prometheus
5) Set Grafana admin password and basic config.
# Set initial admin password
sudo /bin/sh -c 'echo -e "[security]\nadmin_password = GF_ADMIN_PASS" > /etc/grafana/grafana.ini'
sudo systemctl restart grafana-server
Reload/Enable & Health Checks
6) Health checks (status and HTTP endpoints).
# Services
systemctl --no-pager --full status prometheus grafana-server | sed -n '1,80p'
systemctl --no-pager --full status prometheus-node-exporter | sed -n '1,40p'

# Prometheus API
curl -s http://PROM_IP:9090/-/ready; echo
curl -s http://PROM_IP:9090/api/v1/targets | jq '.data.activeTargets | length' 2>/dev/null || true

# Grafana web (open in browser): http://PROM_IP:3000  (user: admin, pass: GF_ADMIN_PASS)
Security / Hardening
7) Lock down ports and avoid exposing Prometheus/Exporter publicly.
# UFW examples (adjust per distro/firewall)
sudo ufw allow from PROM_IP to any port 3000 proto tcp    # Grafana from admin IPs
sudo ufw allow 9090/tcp    # if you need Prometheus web; otherwise restrict by source
sudo ufw allow 9100/tcp    # node_exporter (limit source to PROM_IP ideally)
sudo ufw enable

# Optional: Grafana service hardening
sudo mkdir -p /etc/systemd/system/grafana-server.service.d
sudo tee /etc/systemd/system/grafana-server.service.d/override.conf > /dev/null <<'OVR'
[Service]
NoNewPrivileges=true
ProtectSystem=full
ProtectHome=true
PrivateTmp=true
CapabilityBoundingSet=
OVR
sudo systemctl daemon-reload && sudo systemctl restart grafana-server
Performance & Optimization — Prometheus Grafana
- Keep scrape_interval at 15s for starters; lower only for specific workloads.
- Avoid exposing exporters externally; keep them on private networks/VPNs.
- Create dashboards from Grafana’s official library (import IDs) instead of building everything from scratch.
8) (Optional) Add recording rules and alerting (basic examples).
# /etc/prometheus/rules.yml
sudo tee /etc/prometheus/rules.yml > /dev/null <<'RULES'
groups:
- name: host_rules
  interval: 30s
  rules:
  - record: node_cpu_seconds_total:rate5m
    expr: rate(node_cpu_seconds_total[5m])
  - alert: HighNodeLoad
    expr: avg(rate(node_cpu_seconds_total{mode!="idle"}[5m])) by (instance) > 0.85
    for: 2m
    labels:
      severity: warning
    annotations:
      summary: "High CPU load on {{ $labels.instance }}"
      description: "Average CPU usage > 85% for 2 minutes"
RULES

# Reference rules in prometheus.yml
sudo sed -i '1i rule_files:\n  - /etc/prometheus/rules.yml' /etc/prometheus/prometheus.yml || true
sudo systemctl restart prometheus
Backup & Restore
sudo tar czf prometheus-grafana-backup-$(date +%F).tgz   /etc/prometheus /var/lib/prometheus   /etc/grafana /var/lib/grafana

# Restore:
# sudo tar xzf prometheus-grafana-backup-YYYY-MM-DD.tgz -C /
# sudo systemctl restart prometheus grafana-server
Troubleshooting (Top issues)
1) Targets are down in Prometheus — wrong IPs or firewalls blocking 9100.
curl -s http://NODE1_IP:9100/metrics | head -n 5 || echo 'Exporter not reachable'2) Grafana login fails — reset admin password.
sudo grafana-cli admin reset-admin-password GF_ADMIN_PASS && sudo systemctl restart grafana-server3) Prometheus won’t start — YAML indentation or bad rule file.
promtool check config /etc/prometheus/prometheus.yml; promtool check rules /etc/prometheus/rules.yml || trueKey Takeaways & Next Steps
- prometheus grafana monitoring stack best practices with dashboards and alerts.
- Prometheus scrapes; Grafana visualizes — start small and add exporters gradually.
- Lock down ports, rotate Grafana admin password, and back up configs/data.
- Next: add Alertmanager, Loki for logs, and blackbox_exporter for external probes.


