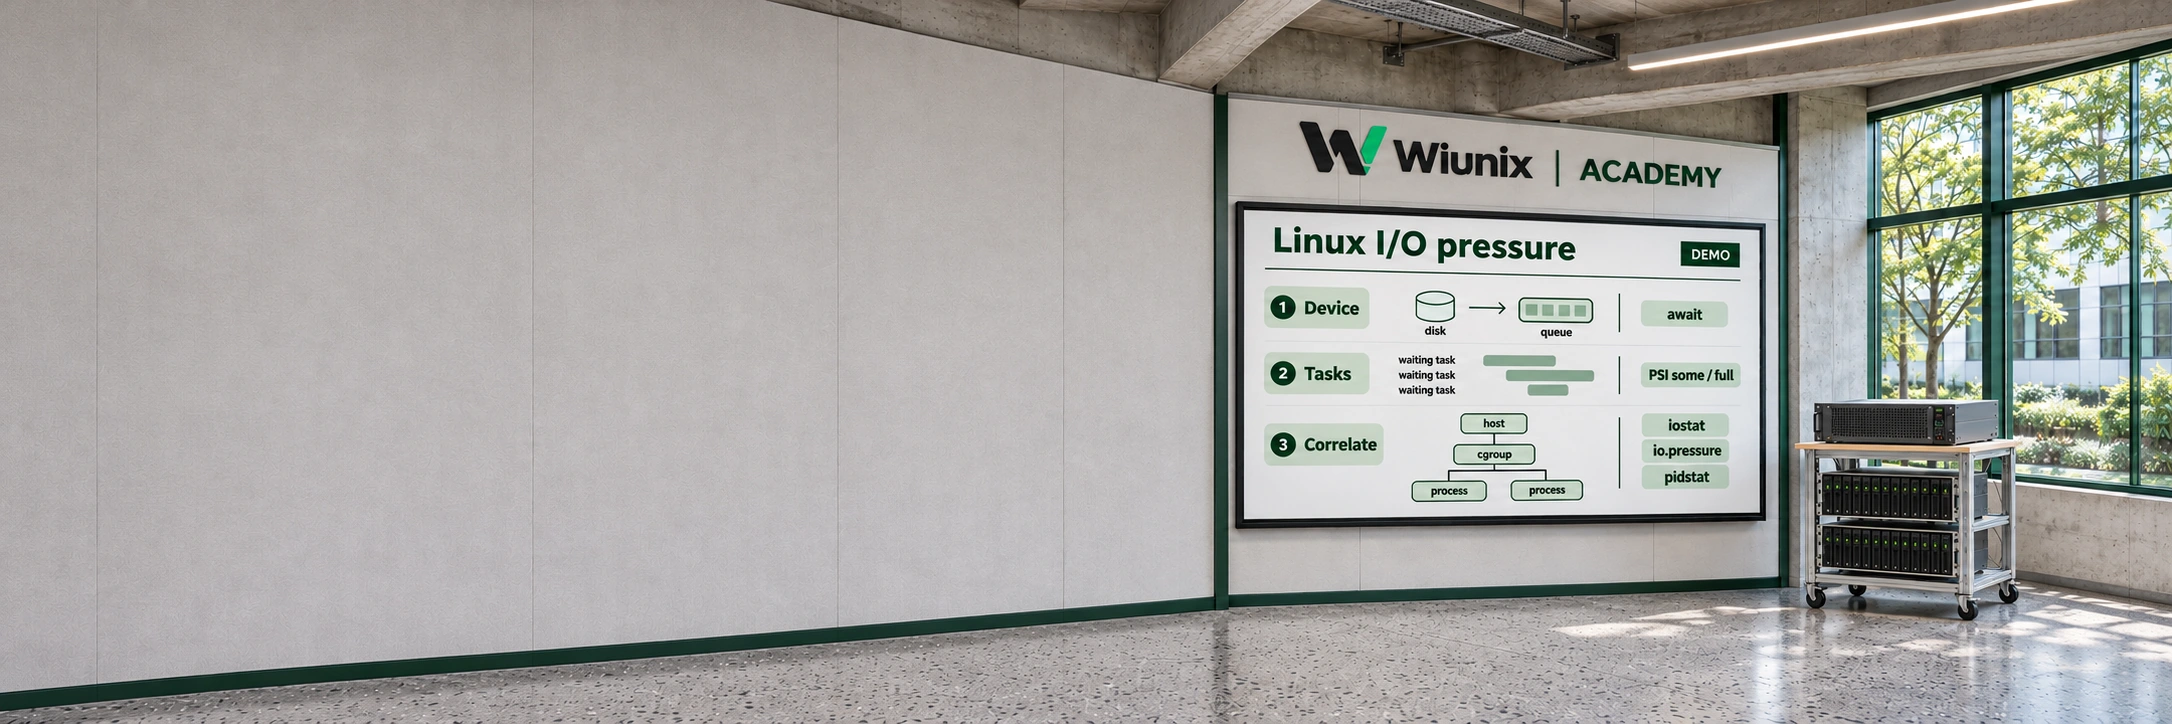
 WIUNIX ACADEMY
Linux I/O latency: connect iostat, PSI and service pressure
Trace a slow application from its data path to device intervals and task stalls. Separate useful I/O, memory pressure and cgroup limits without benchmarks or kernel tuning.
Make this guide yoursYOUR SYSTEM. YOUR STEPS.
Where are you working?
Choose your OS and version. The prerequisites, commands and troubleshooting follow your environment.
USE YOUR OWN VALUES
Configure this tutorial
Set the example values for your environment; related explanations and copy panels update together. Never enter passwords, private keys or tokens. Values stay in this tab and are not sent to the server or share links. Check actual DNS, certificates and network policy before running commands.
Different IP addresses, domains or ports? Open the settings below, change the values and select “Apply to tutorial”, then copy the updated commands.
Set values for my environment4 editable values
THE OUTCOME
What will you have at the end?
Trace a slow application from its data path to device intervals and task stalls. Separate useful I/O, memory pressure and cgroup limits without benchmarks or kernel tuning.
Supported operating systems and versions
Documentation-reviewed on 2026-11-05 for Ubuntu 26.10 and 26.04/24.04 LTS, Debian 13/12, RHEL/Rocky/AlmaLinux 10/9 and rolling Arch/Manjaro. Package preparation differs; PSI and cgroup v2 availability must be observed on the actual kernel. This is not an executed all-distribution matrix.
Before you begin
- Authorized access to the affected host, an incident time window and a specific application operation with latency/error evidence.
- Existing sysstat, procps or procps-ng and util-linux tools; any installation is a separately approved maintenance action.
- Existing systemd and readable cgroup v2 for the optional service branch; remote storage additionally needs server/provider evidence.
- Diagnostic output may disclose process names and internal paths; retain it only in an approved private location.
Is storage making the application wait?
Start with a slow request or job and its time window. A busy device is not automatically a bottleneck, and an idle CPU does not prove storage is healthy. This investigation connects three views: application impact, tasks stalled for I/O, and activity on the relevant storage layer. It makes no benchmark writes or tuning changes.
The workflow is for an existing systemd Linux host with local block-backed storage. For NFS, distributed filesystems, container overlays or managed cloud volumes, identify that layer first and use its own client/server or provider telemetry too. Host counters do not reveal every remote queue or a cloud volume’s remaining burst credit.
Keep an incident time window, application latency/error measurements and a normal comparison period. There is no universal healthy await, queue length or PSI percentage: the useful question is whether a sustained change coincides with the workload’s missed objective.
LET’S BUILD
Identify the host and observation tools
Use an authorized host shell, not an arbitrary container shell: mount, PID and cgroup namespaces can show different scopes. Compare the selected distribution with the actual release and kernel. sysstat supplies iostat and pidstat; procps supplies vmstat on DEB systems, while RPM and Arch families call that package procps-ng.
The checks below install nothing. Resolve missing tools through the host’s approved package-management process before continuing. The following optional installation panel changes packages; it is not a required step on an incident host. No sar collector, timer or service needs to be enabled for these short interactive samples.
Use this Ubuntu release’s official repositories. The 26.04/24.04 paths are LTS; 26.10 is the interim release with a shorter support window.
Authorized terminal on the affected Linux host
cat /etc/os-release
uname -r
ps -p 1 -o comm=
dpkg-query -W sysstat procps util-linux coreutils systemd
command -v iostat pidstat vmstat findmnt lsblk systemctl date
iostat -V
pidstat -VThe OS/kernel and installed tool versions are known. PID 1 is systemd for the optional unit/cgroup branch. Missing tools remain a preparation issue, not a zero measurement.
LET’S BUILD
Optional: prepare missing tools in an approved change window
Skip this panel when the required tools already exist. On an approved lab or maintenance window, review the package transaction and obtain tools only from the selected distribution’s official enabled repositories. Package installation can start package-owned units; review the transaction and resulting unit state rather than enabling historical collection just for this lesson.
The remaining observations are read-only, but still consume resources. Keep sample counts bounded and evidence private. Existing AppArmor, SELinux, procfs restrictions and delegation boundaries remain in place; a permission error is a visibility limit to resolve with the host owner, not a reason to disable protection.
Authorized terminal on the affected Linux host
sudo apt-get update
sudo apt-get install sysstat procps util-linux coreutils
command -v iostat pidstat vmstat findmnt lsblkRequired commands resolve after the reviewed package transaction; no manual collector/service enablement is performed.
LET’S BUILD
Map the application path to the storage stack
Set /var/lib to an existing application data directory. findmnt identifies its filesystem in this mount namespace. lsblk then exposes the block-device tree and major:minor identifiers. Follow a mapper, LVM or RAID device to its backing devices rather than assuming the first nvme name belongs to this application.
Keep each layer distinct. A request may appear at both a logical volume and its physical device; adding their byte counters double-counts the same work. If the source is a network filesystem or an overlay, stop the local-device attribution branch and investigate the real backing path with its owner.
Authorized terminal on the affected Linux host
test -d '/var/lib' || exit 1
findmnt --target '/var/lib' -o TARGET,SOURCE,FSTYPE,OPTIONS
lsblk -o NAME,KNAME,MAJ:MIN,TYPE,SIZE,FSTYPE,MOUNTPOINTSThe data path, filesystem and relevant logical/physical device layers are recorded; remote or overlay scope is explicitly identified.
LET’S BUILD
Measure stalled tasks over a short window
PSI measures task stalls rather than device busy time. For I/O, some means at least one task is stalled; full means all non-idle tasks in that scope are stalled together. avg10, avg60 and avg300 are percentage trends for those windows, while total is cumulative stall time in microseconds. full is a subset of some, so never add them.
Read host I/O and memory pressure twice, with UTC timestamps. A short spike can increase total while barely moving the longer average. Rising memory pressure and swap activity can accompany I/O stalls; that correlation needs the next observations before concluding the device itself is slow. A missing pressure file means PSI is unavailable in this kernel or scope, not that contention is absent.
Authorized terminal on the affected Linux host
date -u +%FT%TZ
for resource in io memory; do
  printf '\n%s pressure\n' "$resource"
  if test -r "/proc/pressure/$resource"; then
    cat "/proc/pressure/$resource"
  else
    printf 'PSI unavailable or unreadable in this scope\n' >&2
  fi
done
sleep 5
date -u +%FT%TZ
for resource in io memory; do
  if test -r "/proc/pressure/$resource"; then cat "/proc/pressure/$resource"; fi
doneTwo timestamped samples show whether cumulative I/O or memory stall time increased. A missing/unreadable interface is reported explicitly.
LET’S BUILD
Read interval latency, throughput and queue together
Run during the observed slowdown and compare with a similar normal workload. The -y option skips iostat’s since-boot report. Read the relevant device layers from the previous map: r_await and w_await include time queued and serviced, aqu-sz describes average outstanding requests, and MiB/s and operations/s show the workload shape.
A high %util means requests were active for much of the interval. It is not a universal capacity meter for parallel NVMe, RAID or virtual devices. Low throughput with increasing await can reflect small synchronous requests, a throttled backend or errors; high throughput with stable application latency may be useful work. Do not calculate service time by subtracting these averages.
Authorized terminal on the affected Linux host
date -u +%FT%TZ
LC_ALL=C iostat -d -x -m -y 1 5Five bounded interval reports can be compared with application impact and PSI; record actual column names and device layers, not a universal threshold.